Blueprint | Discover Hidden Patterns in Your Training Data
Optimizing your freediving performance requires more than just physical training—it’s about understanding your data. Learn how to structure your training logs, use formulas, pivot tables, and charts to track progress, analyse efforts, and plan smarter for better results.

Freediving training is as much about understanding your body and its limits as it is about physical preparation. A well-structured approach to analyzing your training data can provide insights that help optimise your performance and structure your training plans. In this post, we’ll explore how you can transform various training data formats into a unified structure to track your progress, analyze your efforts, and plan for improvement. We will use free online tools to support our analysis.
Data Sources
Training logs are often maintained in some sort of structured format such as Excel or CSV. Many freedivers collect their training log in plain text format that makes analysis impossible. Training log structure and correct tools provide flexibility for data analysis and sharing. If you have your data in some sort of written, unstructured training log you will need to transform it to structured format. Read next chapters to see how to achieve this.
Outputs from wearable devices like Garmin and Suunto are also very useful. They capture detailed metrics, including performance data and health statistics, and can be used to enhance your training insights. STAmina application reports help track progress by monitoring breath-holds, recovery times, related to apnea training. They can be exported in CSV format and analysed in the same way as your structured data.
Unified Training Log Format
To effectively analyze your data, start by organizing it into a unified tabular format.
Key training log fields include:
- Apnea Time: How long you hold your breath.
- Distance Covered: The length of your swim per apnea.
- Rest Time: Time spent recovering between repetitions.
- Drill Type: Specific exercise, e.g., static apnea, dynamic apnea, or CO₂ tolerance drills.
- Lung Volume: How much air did you take to perform the drill.
- Target Metrics: Personal bests or goals for distance and apnea times.
- Remarks: Notes on conditions affecting performance (e.g., fatigue, diet).
- Heart Rate: Starting and minimal values.
These metric can be extended depending on your goal, discipline and particular issue that you try to fix.
Some additional fields could include:
- Minimal SpO₂: Lowest oxygen saturation recorded during a session.
- Leg kicks / Arm strokes Count: per 25m to assess efficiency.
- Pace: Your speed during each repetition.
Insights from Training Logs
Consider the data you have to gain better insights into certain aspects of your training and current focus. What information would be most valuable to you? What specific details do you need? What type of feedback would help you reflect on your recent weeks and plan your future training sessions more effectively?
Use these insights to structure future training sessions intentionally, targeting weaknesses and building on strengths. With the right data, you can train smarter and reach your goals more effectively.
Here are some ideas of insights that you could get from the data.
Training Volume
- Distance: Total meters swum per week/month.
- Apnea Time: Cumulative time spent holding your breath.
Effort Analysis
- Track submaximal and maximal efforts with outcome indicators.
- Compare CO₂ and hypoxia drills for different training types.
Performance Trends
- Analyse number of leg kicks/arm strokes per distance and correlate with pace to understand efficiency improvements.
Goal Tracking
- Compare actual performance to set targets for apnea times and distances.
- List results and attempts for each goal over a selected period.
General analysis approach
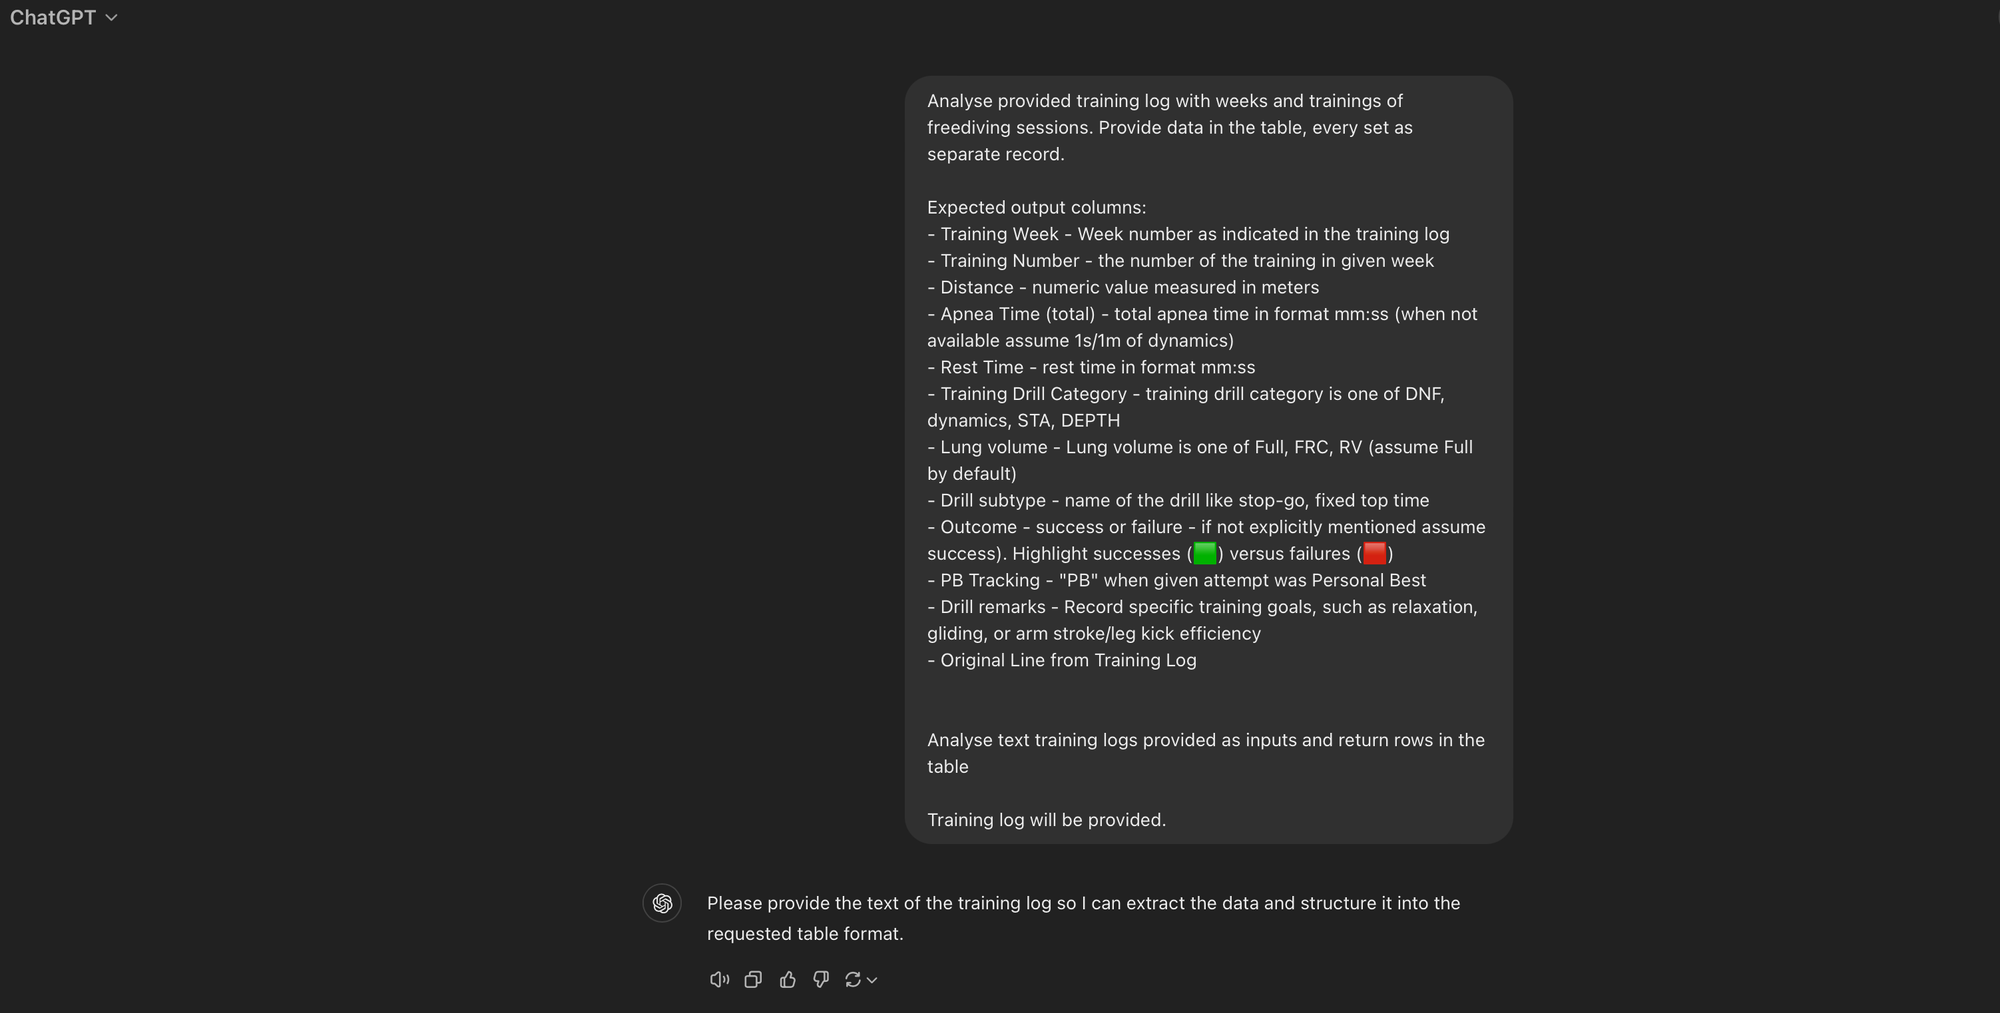
Plain text data pre-processing with GenAI
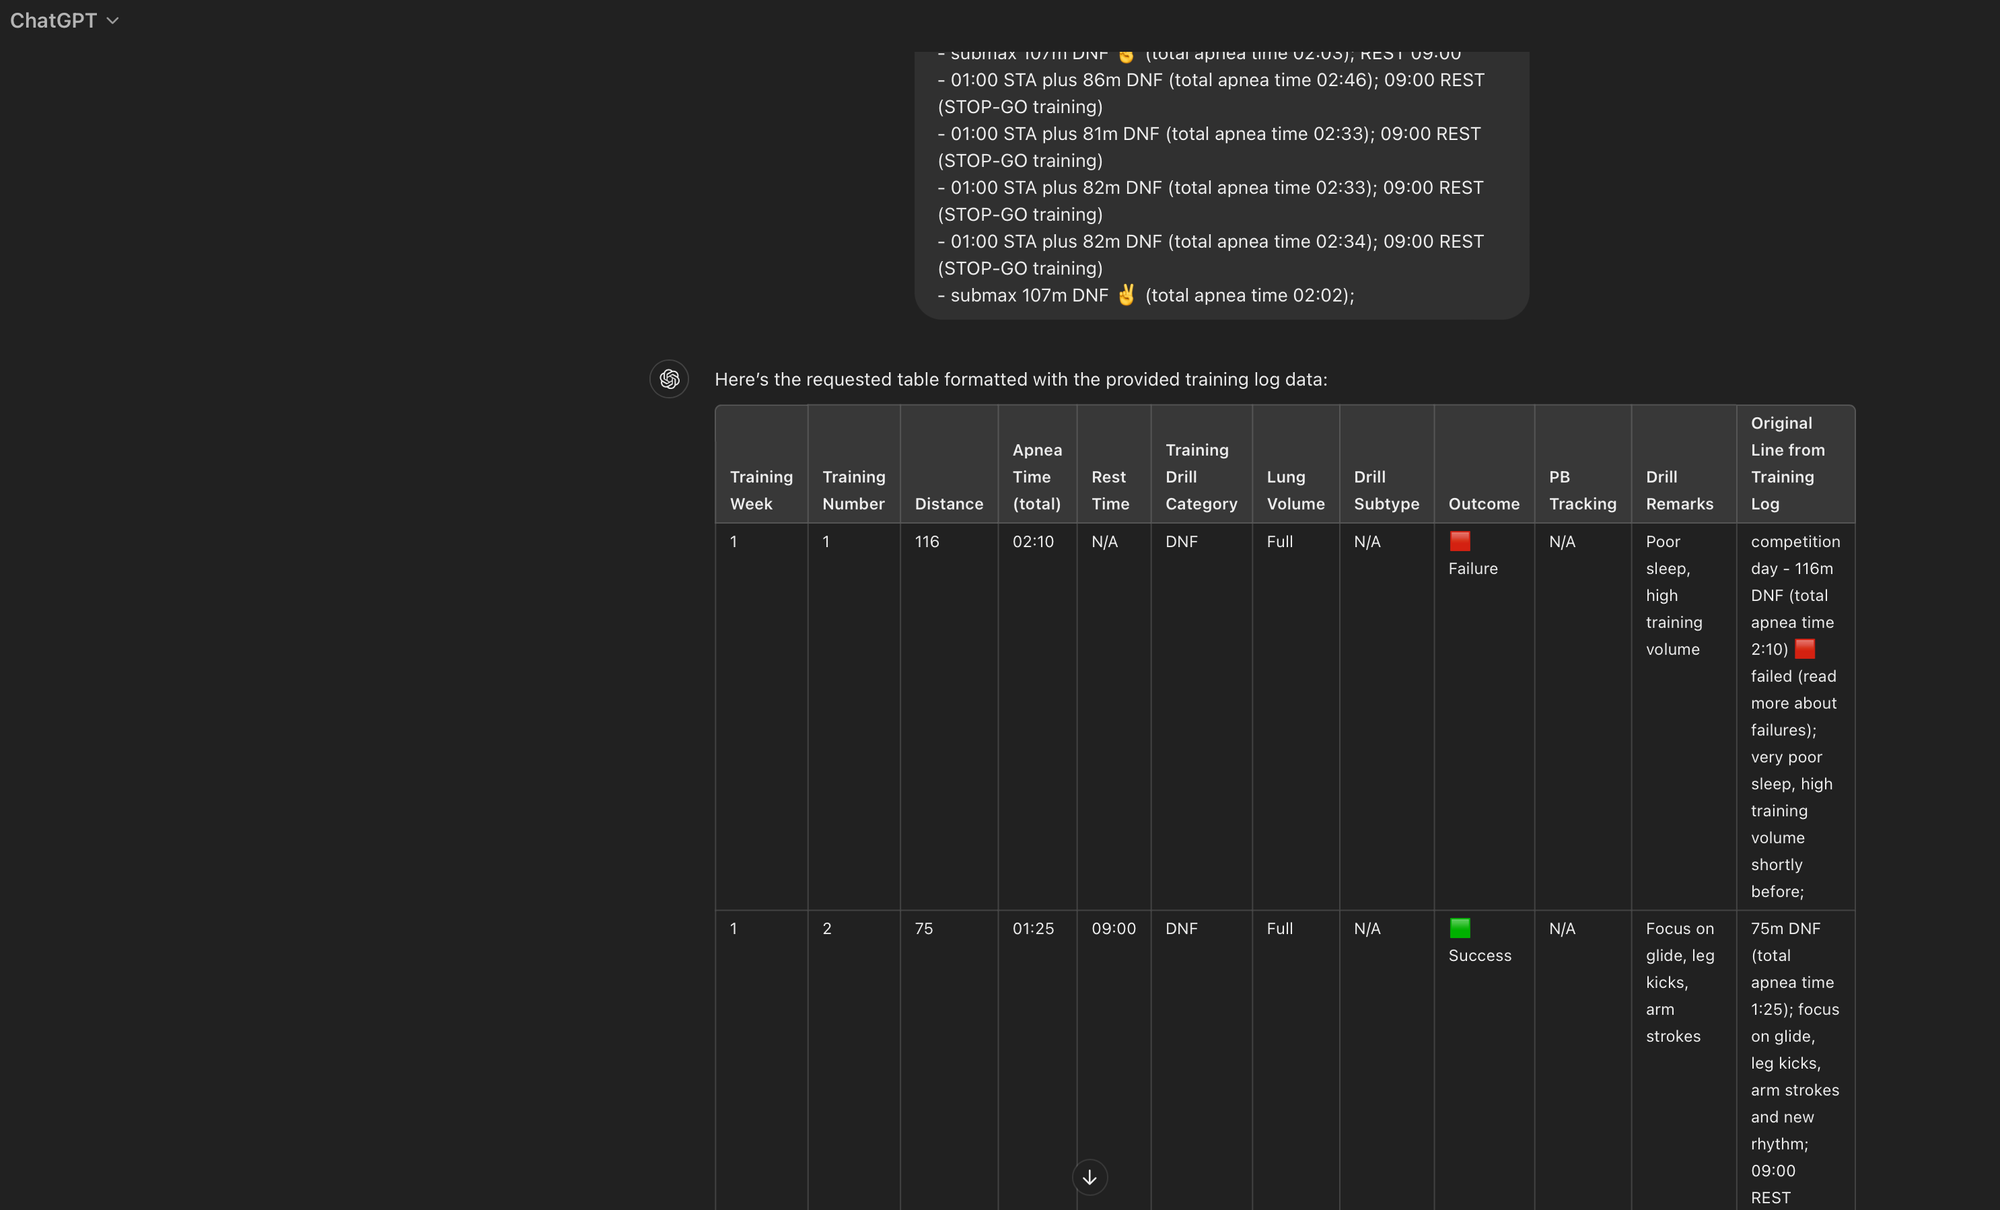
- Use GenAI to summarise plain-text training logs into structured formats.
- Automate repetitive data preparation tasks to focus on analysis.
- Post-process / review GenAI outputs
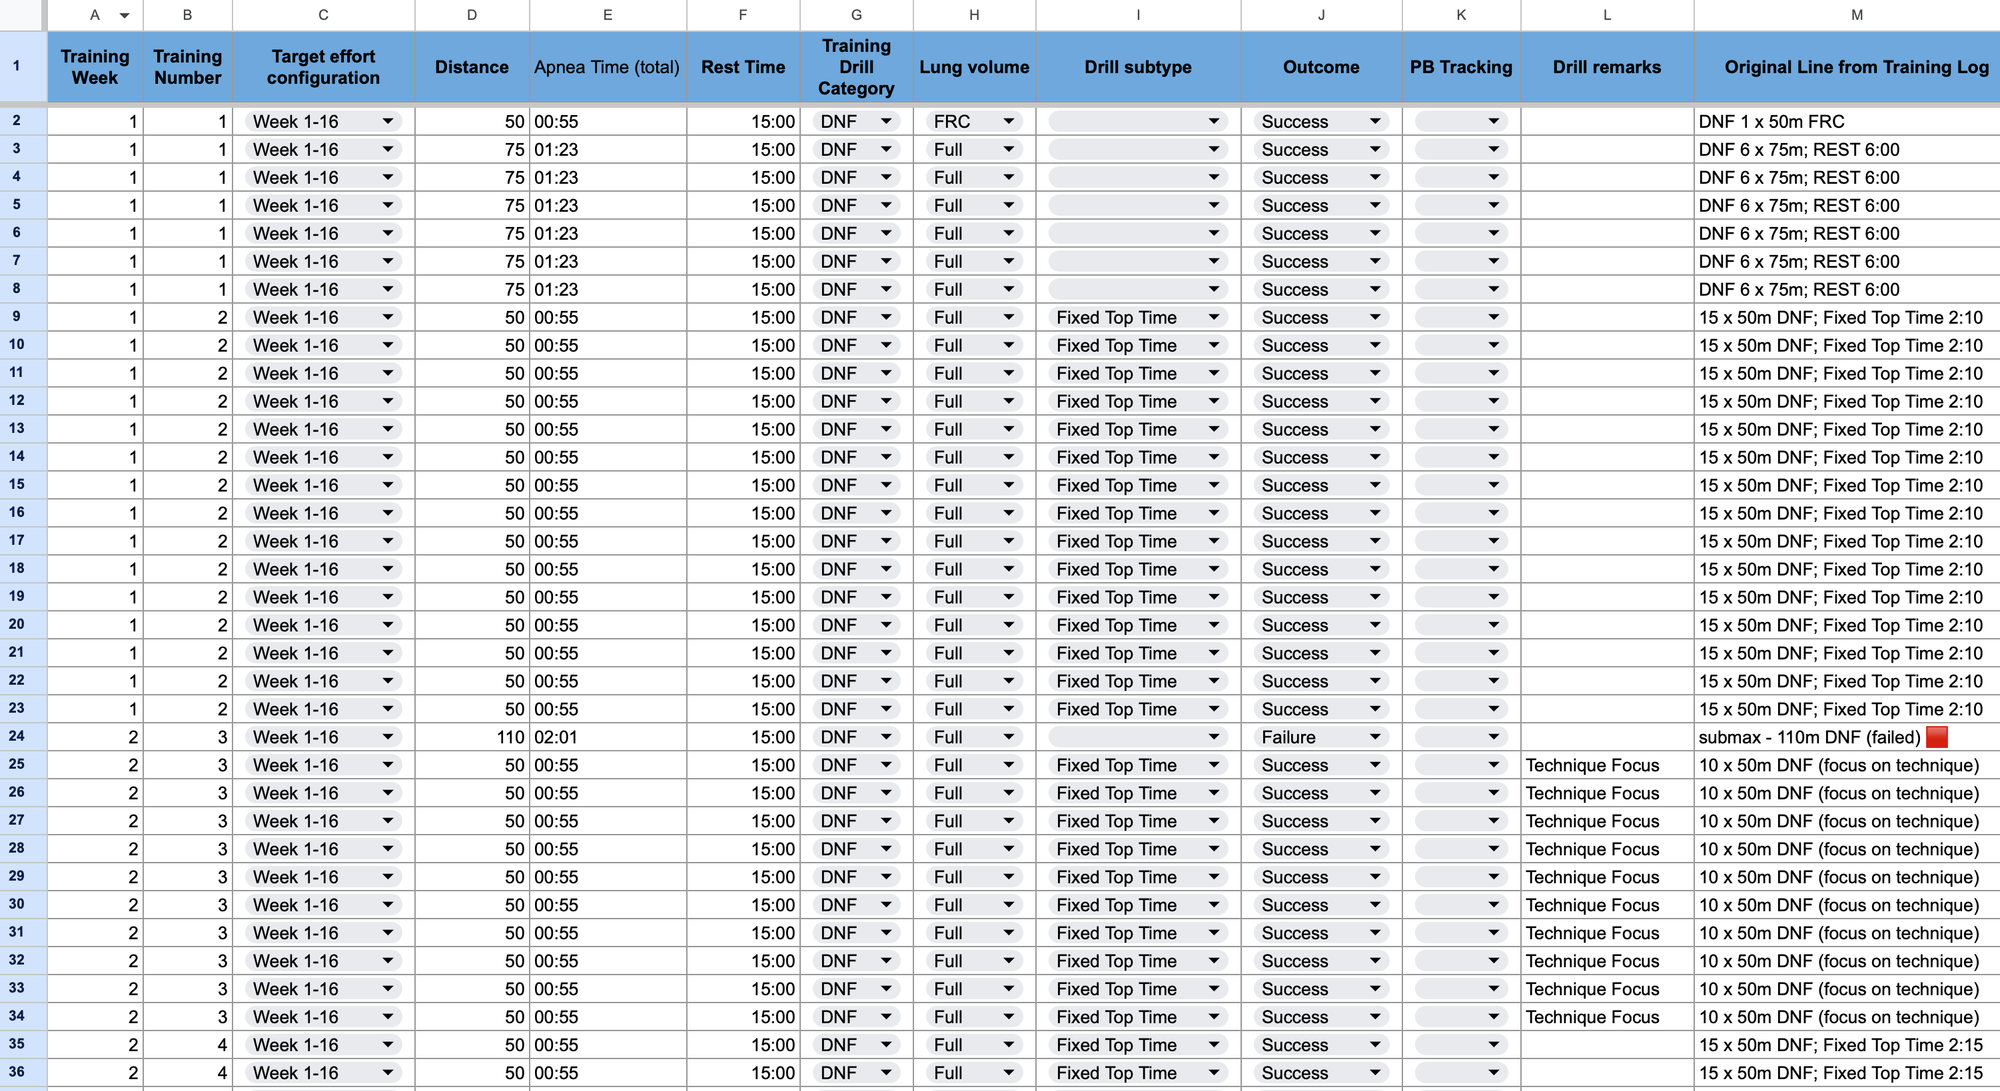
Tabular data pre-processing with Google Sheets
- Use formulas to clean and unify your data.
- Ensure fields like apnea times, distances, and repetitions are accurately logged.
- Standardise data formats for easy grouping.
- Add calculated fields that will enhance your data.
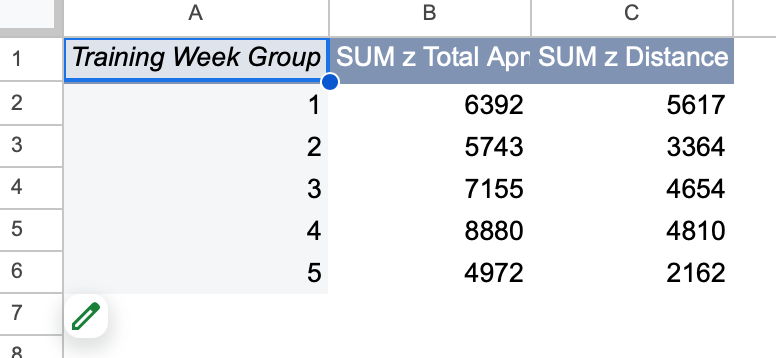
Use Pivot Tables to group data by week, month, or session.
- Start with simple configurations:
- Rows: Month or week.
- Columns: Drill outcome or drill effort level.
- Values: Distance, apnea time, or number of trainings.
- Split complex insights into separate pivot tables for clarity.
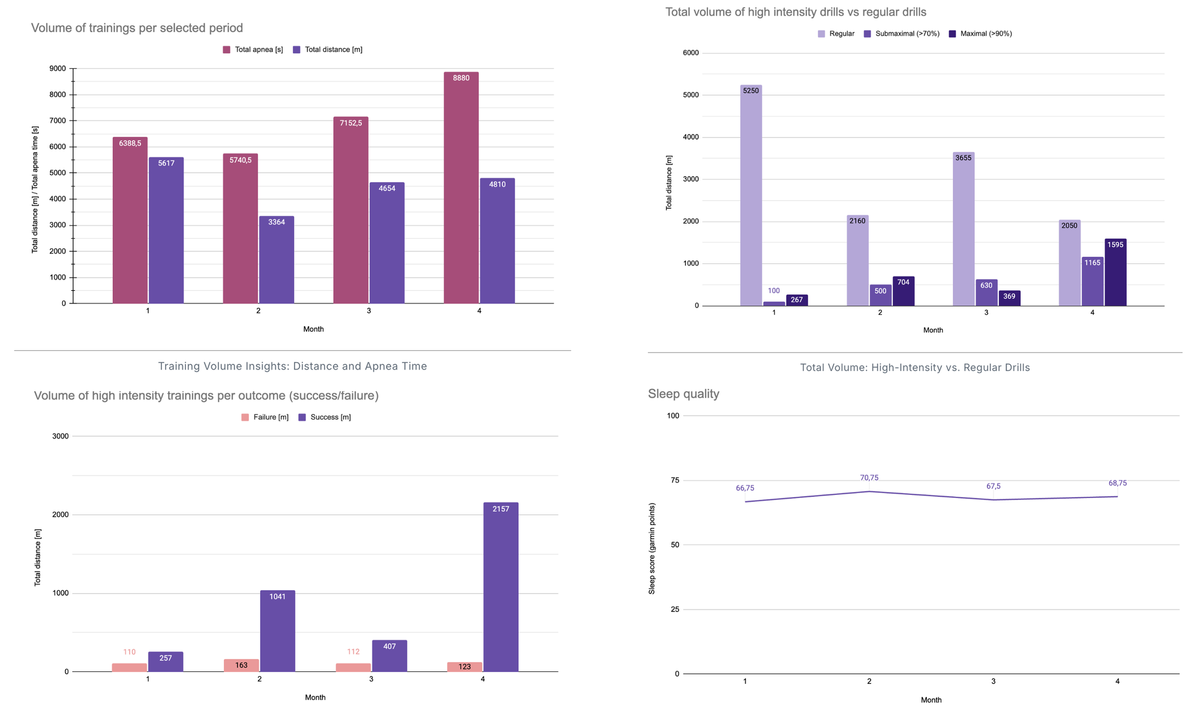
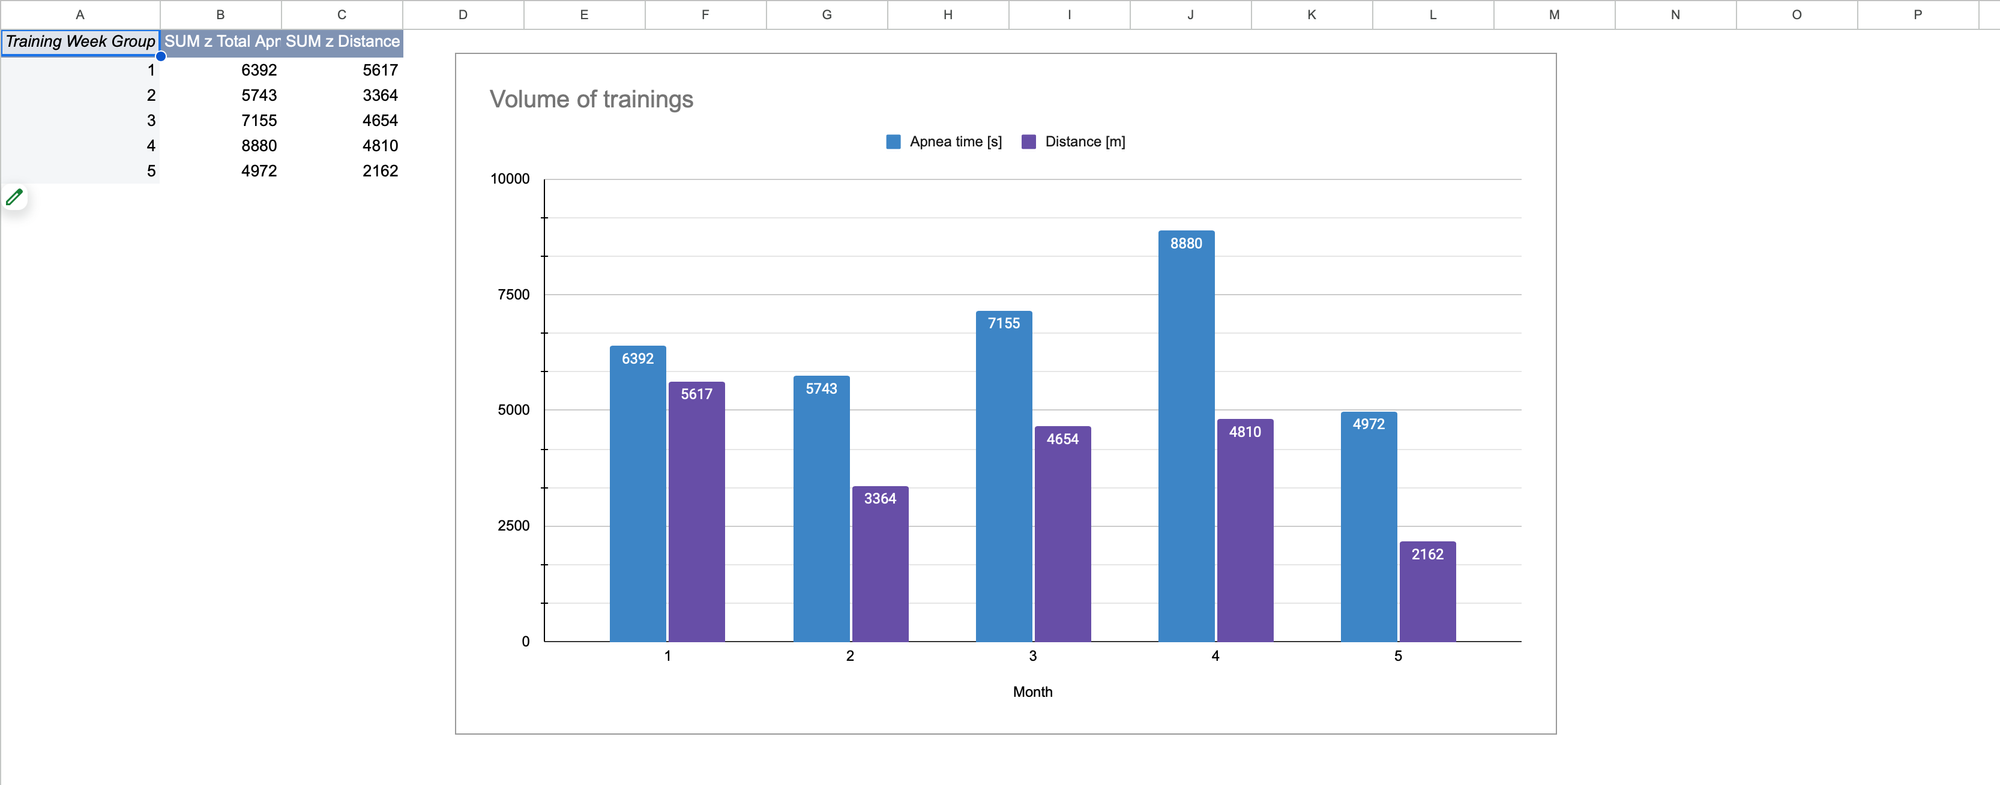
Leverage Pivot Table based charts to visualise trends
- Add chart based on pivot table data.
- Adjust chart data series, titles, colors and guidelines to better showcase your report
- Move charts to external tab to have all of them in one place
Integrate External Data
- Copy structured data for metrics from external sources –wearables and STAmina– to your spreadsheet.
- Adjust format of external data by applying formulas and add additional columns that will allow you to group and summarise (e.g. by traing week or month).
- Define Pivot Tables and charts in the same way as for training data.
By systematically organizing and analyzing your freediving training data, you can identify key trends, measure progress toward goals, and optimize your performance. Tools like Google Sheets, coupled with insights from GenAI, simplify the process, making data-driven training accessible to all freedivers.
Start building your training log today and unlock the full potential of your freediving abilities!
From Theory to Practice
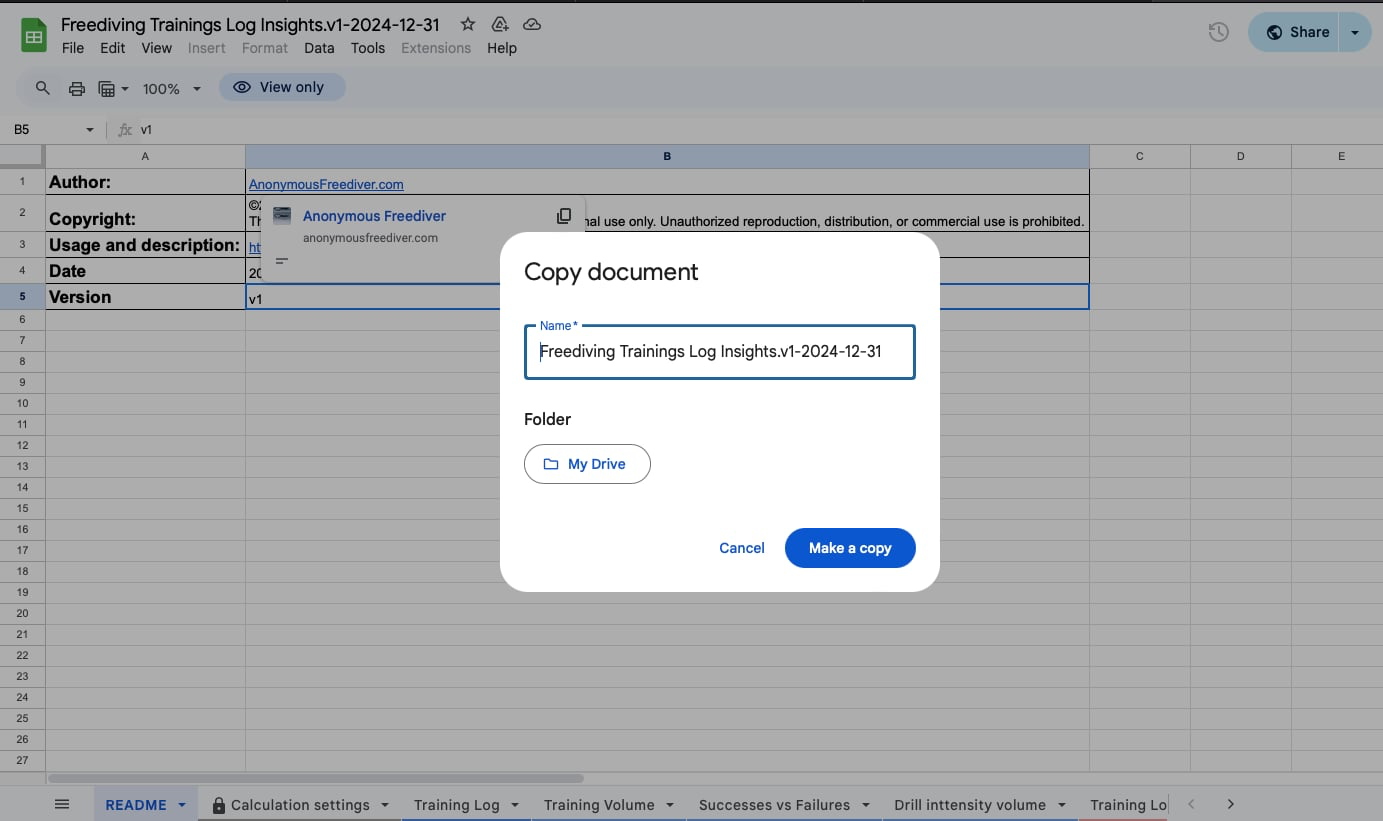
Download template to start creating your own training log. You can create a copy and explore it independently or follow the example below to see how it can help you track and improve your performance.
To stay informed about updates (such as changes in format, new formulas, or additional fields), please leave a comment below this article.
Continue reading this article as a Freediving Buddy member and check detailed step-by-step guide on building a training log using a spreadsheet template. You'll learn how to use GenAI, which formulas I added, how to customise the spreadsheet to suit your needs, and how to gain valuable insights from it.
Examining real-life examples of pivot tables and charts will help you gain a clearer understanding of what you can accomplish with your data.